Australia’s best capital cities and areas to own an EV
Electric vehicles are becoming a more common choice for Aussie drivers, but where you live can make a big difference to how easy the switch is. From charging access to running costs, some parts of the country are better set up than others for EV ownership.
At ROLLiN’, we analysed data across Australia to understand where everyday Aussies are best set up to own an EV. Looking at Greater Capital City Statistical Areas (GCCSAs) and all 88 Statistical Area Level 4 (SA4) regions, we scored each on four key factors: charging infrastructure availability, charging costs, current EV ownership rates, and how quickly adoption has grown since 2021. The results highlight the areas leading the way in making EV ownership more practical. For drivers considering the switch, check out ROLLiN’s Comprehensive Car Insurance which covers EVs too..
THE MOST EV-FRIENDLY CAPITAL CITIES IN AUSTRALIA
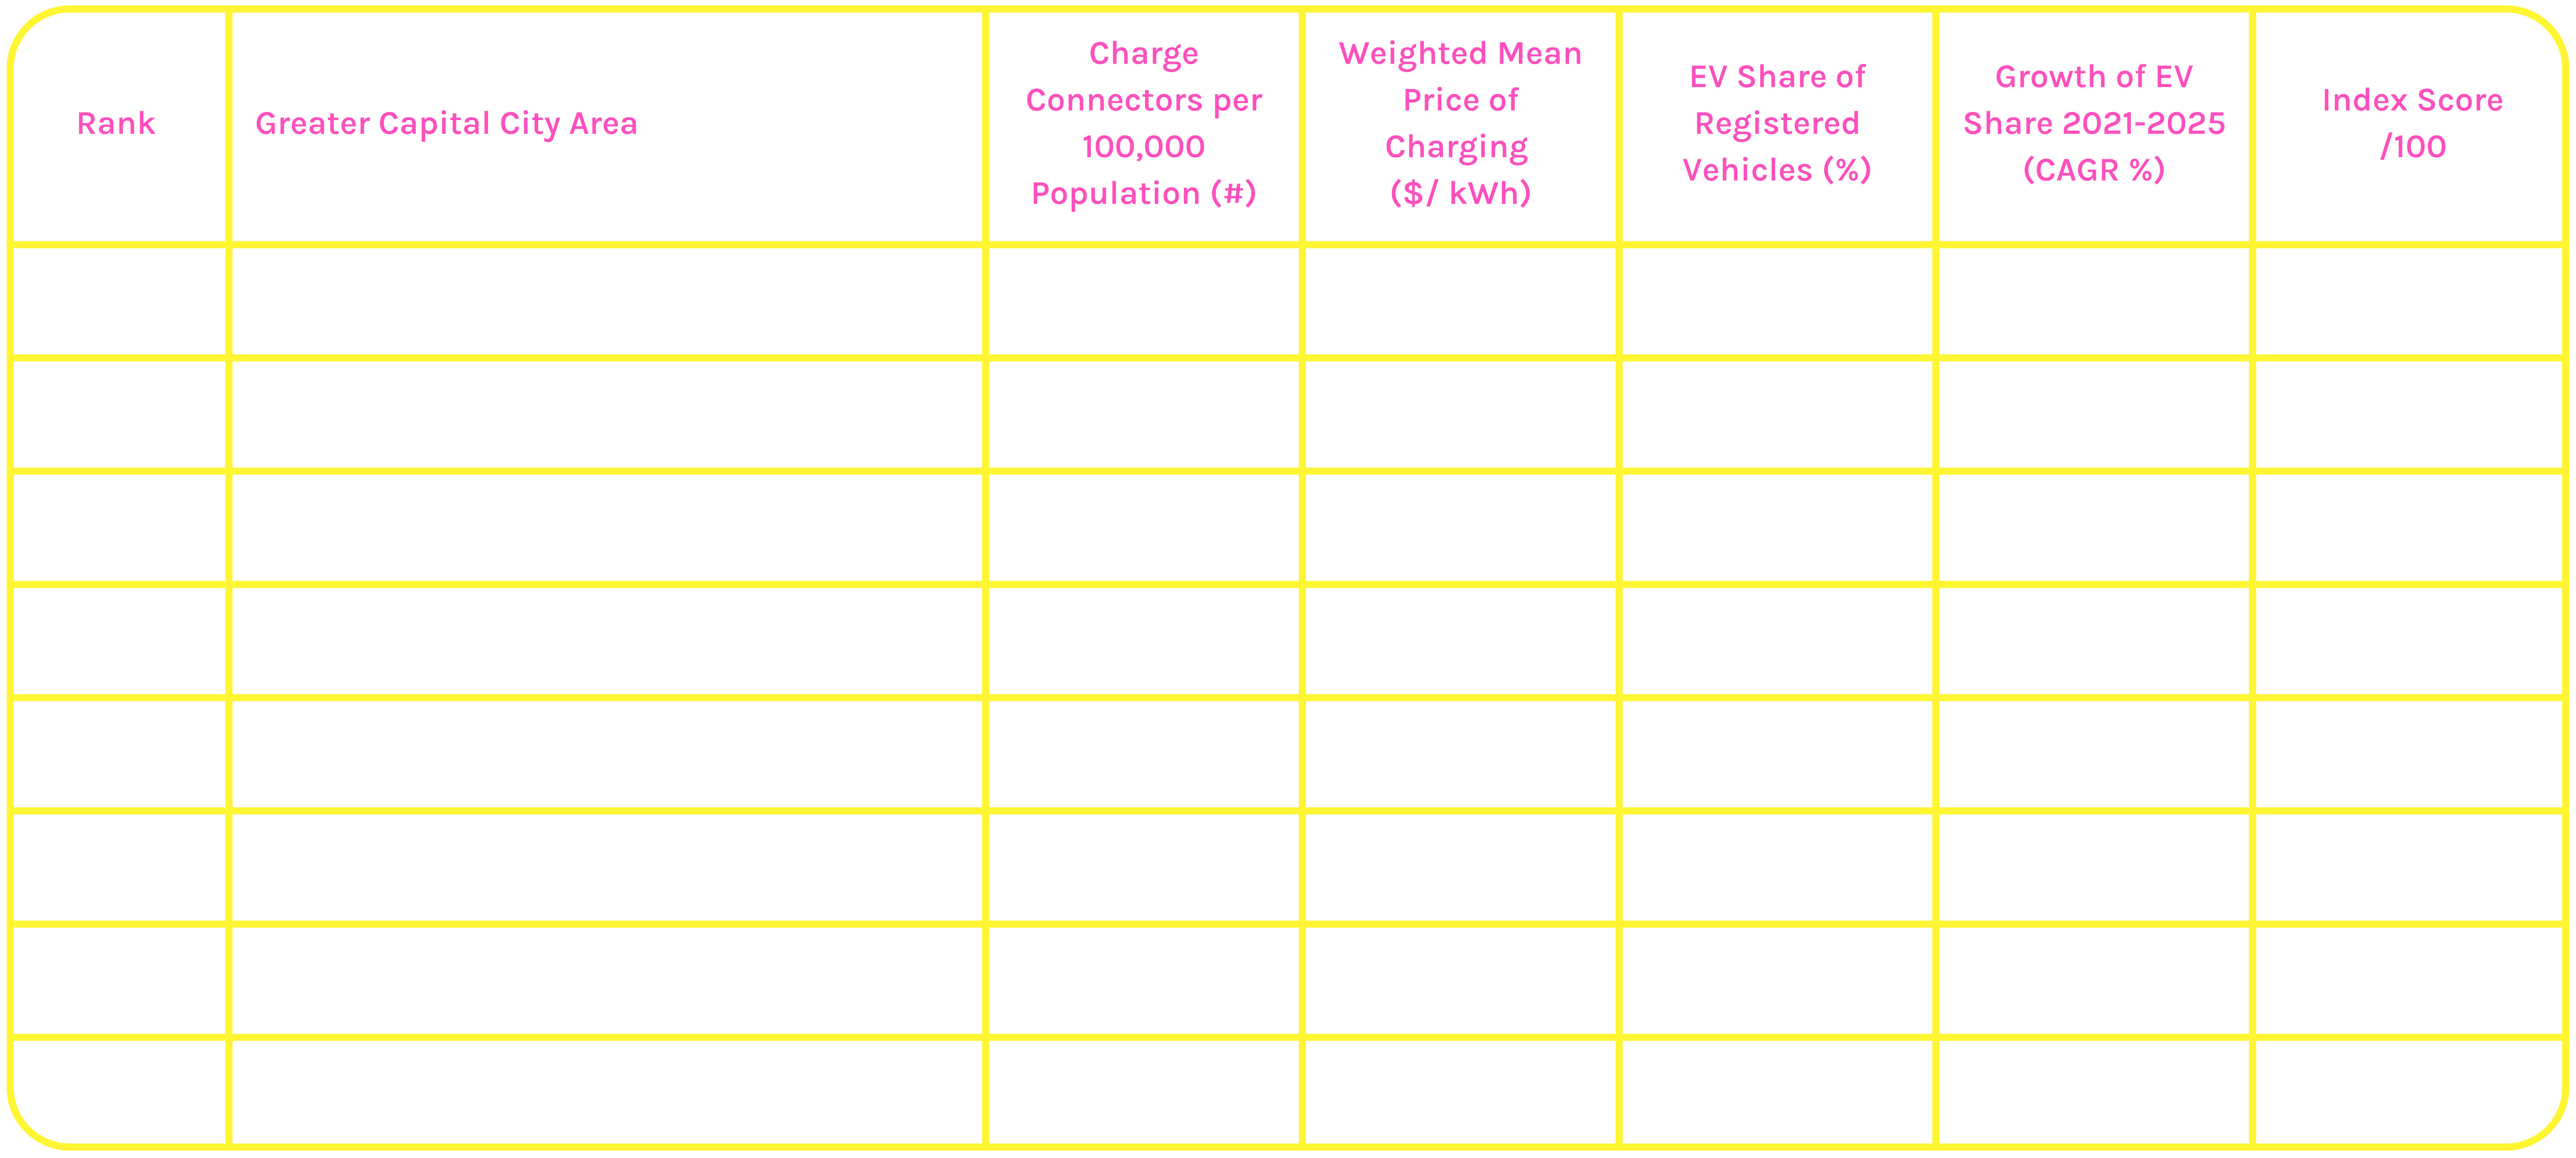
"Cities" refer to Australian Bureau of Statistics (ABS) Greater Capital City Statistical Areas (GCCSAs). Canberra (ACT) refers to the Australian Capital Territory GCCSA. The ACT, Greater Darwin and Greater Hobart each correspond to a single SA4 region in this dataset, meaning their GCCSA and SA4 figures are identical. Charging cost reflects the connector-weighted mean price per kWh across publicly available charging networks with published pricing data within each area, and may not reflect all publicly accessible charging options or price variations across different charging speeds and networks. All figures are as at the date of data collection (April 2026) and reflect publicly accessible charging stations only.
Own an EV in Canberra? You’ve got something to brag about
The nations capital is the best city to drive an EV. With a score of 84.37 out of 100, it leads by more than 21 points ahead of second-placed Greater Perth. The city leads for both EV uptake and charging infrastructure: over 3% of registered passenger and light vehicles are electric, and there are more than 80 charging connectors per 100,000 residents.
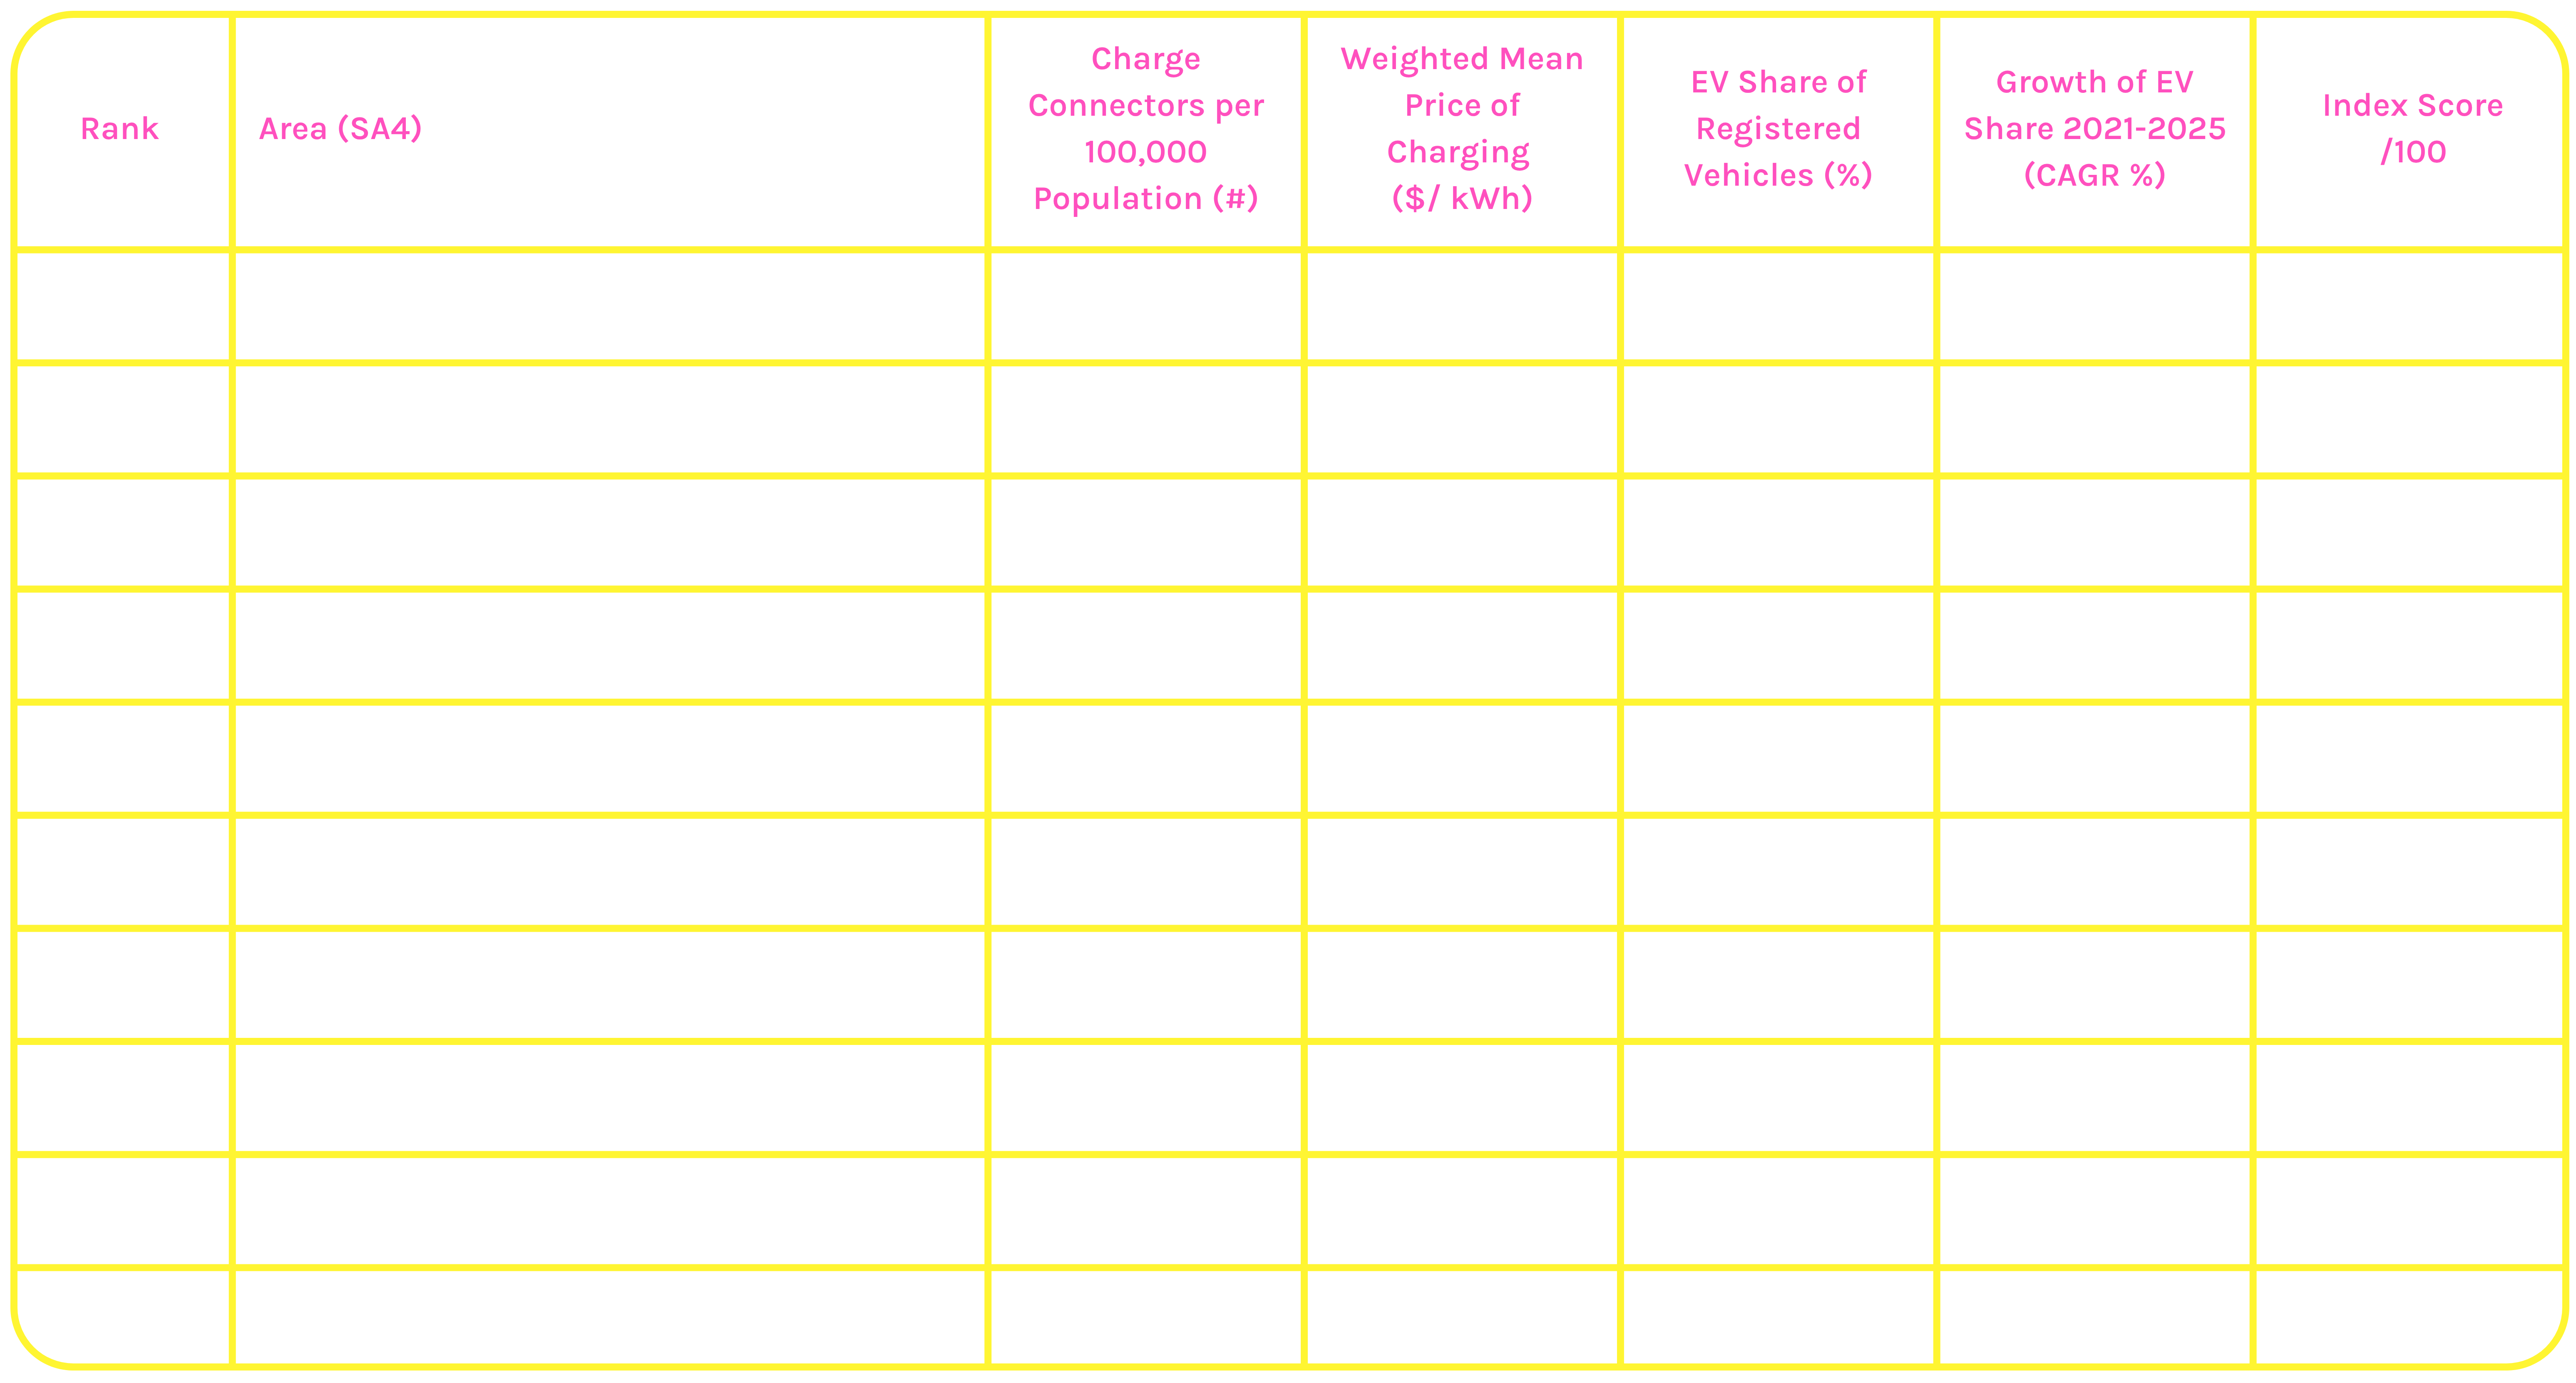
THE MOST EV-FRIENDLY AREAS IN AUSTRALIA
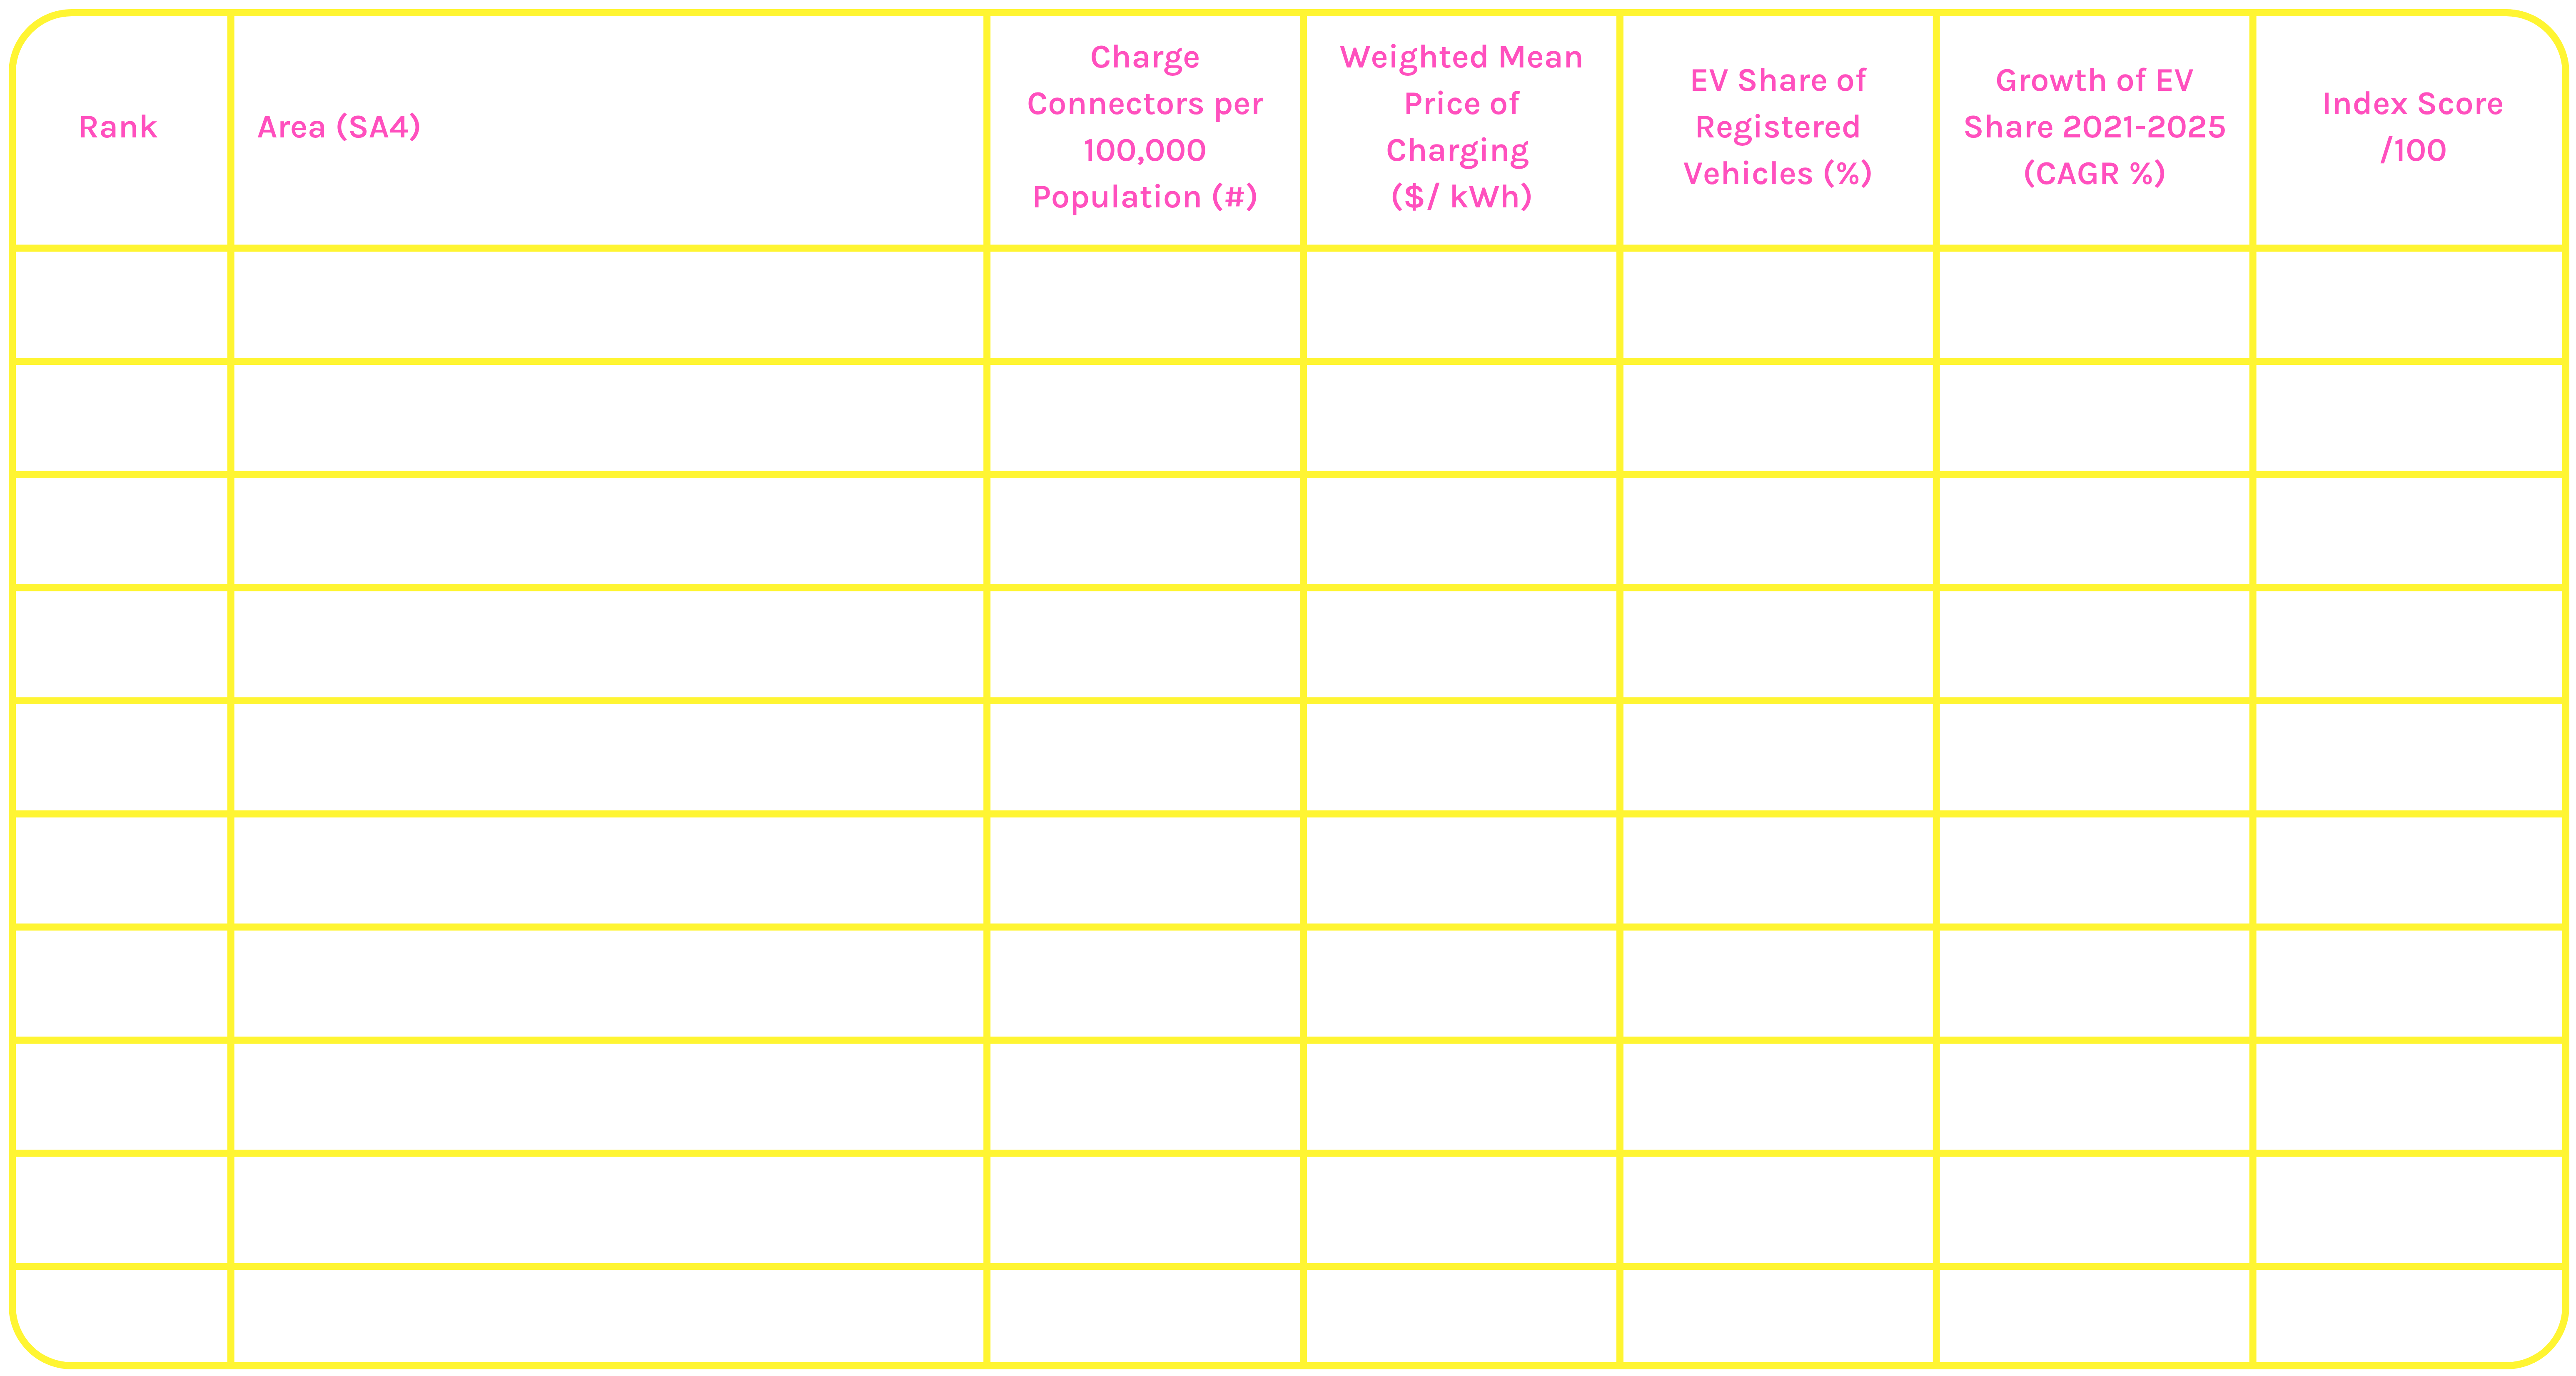
"Areas" refer to Australian Bureau of Statistics (ABS) Statistical Area Level 4 (SA4) regions. Charging cost reflects the connector-weighted mean price per kWh across publicly available charging networks with published pricing data within each area, and may not reflect all publicly accessible charging options or price variations across different charging speeds and networks. All figures are as at the date of data collection (April 2026) and reflect publicly accessible charging stations only.
When it comes to specific areas and districts, Inner Perth takes the top spot as Australia’s most EV-friendly area with a score of 75.70. It’s a place where going electric just fits the lifestyle, seen through plenty of charging options, below-average charging costs, and EVs already making up 2.54% of registered vehicles on the road.
Sydney’s Eastern Suburbs follows closely with a score of 74.55. Clearly, this area is pairing beachside living with EV convenience. It has plenty of charging options, alongside relatively low charging costs. The area ranks 7th nationally for registrations, and with EV ownership growing by 60.6% on average each year, more locals are making the switch.
Rounding out the top three is Adelaide’s Central and Hills area, scoring 72.32. It has the second-lowest charging cost nationally and almost 100 chargers per 100,000 people. While EV uptake is on the lower side at 1.72%, EV ownership is growing quickly, recording 102.1% average annual growth.
THE TOP AREAS FOR EV INFRASTRUCTURE
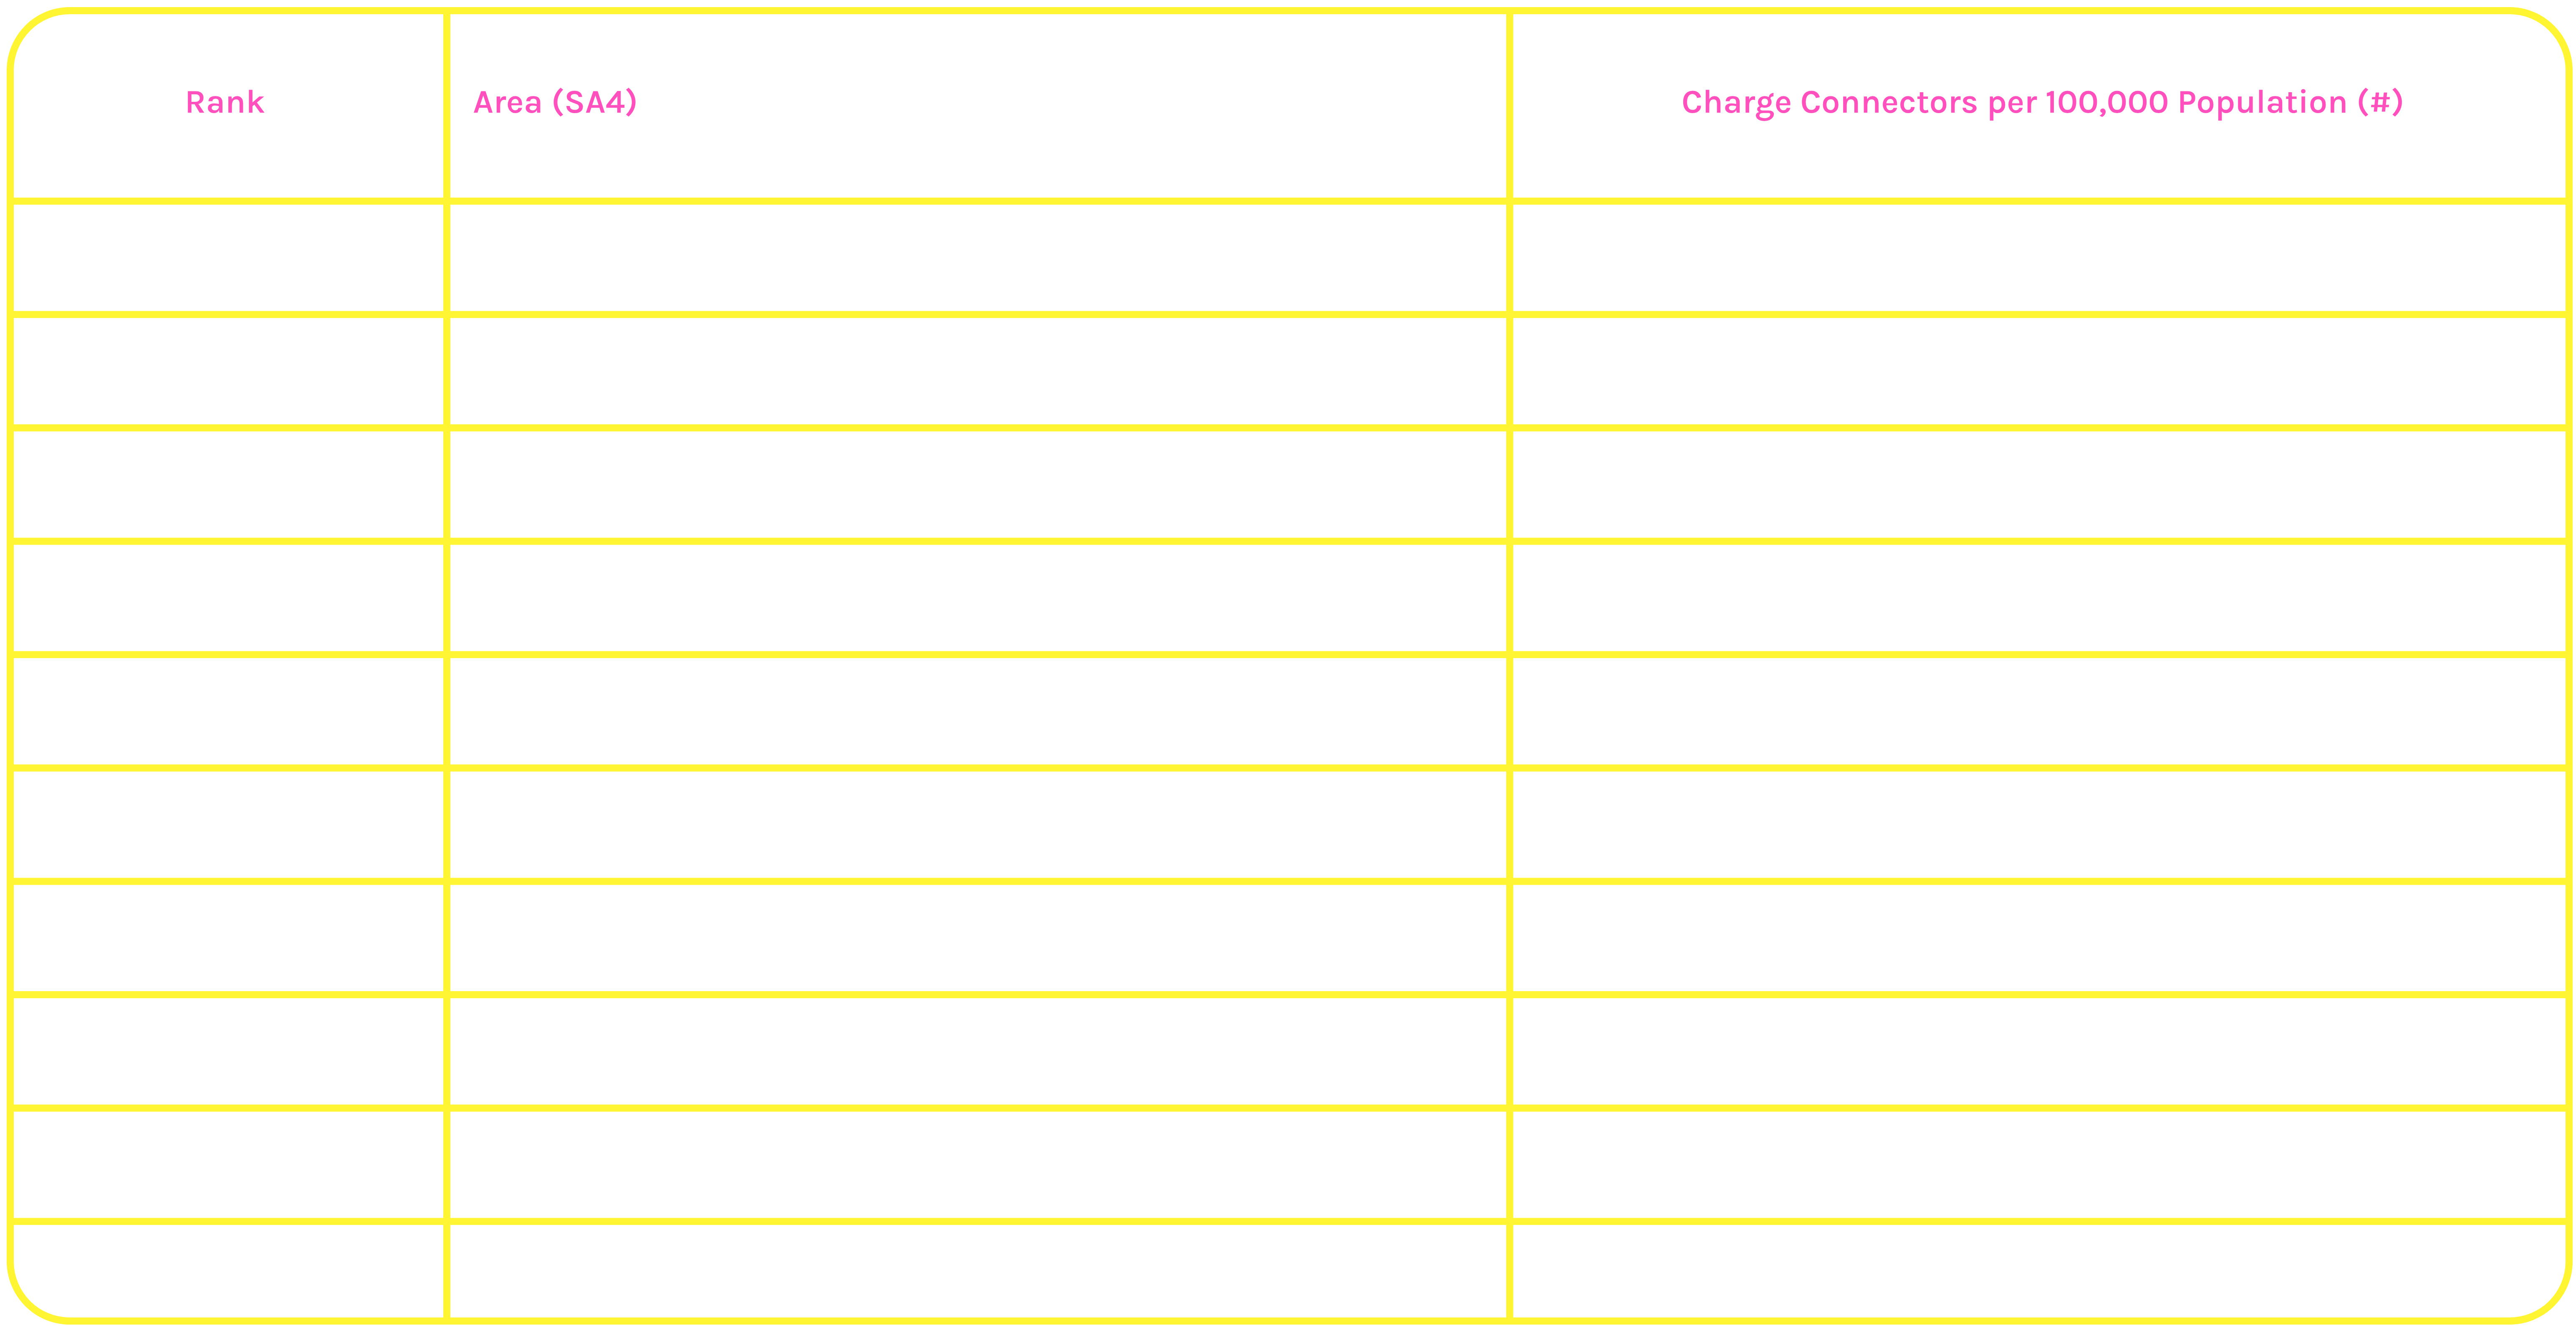
"Areas" refer to Australian Bureau of Statistics (ABS) Statistical Area Level 4 (SA4) regions. All figures are as at the date of data collection (April 2026) and reflect publicly accessible charging stations only.
EVs run on batteries, so easy access to charging is a big deal when you own one. Surprisingly, eight of the top ten areas for charging availability are considered regional, showing how quickly infrastructure is expanding beyond major cities. Leading the way is Barossa - Yorke - Mid North in South Australia with 208.04 connectors per 100,000 people, followed by the Murray area with 177.59 and the South Australian Outback with 174.57.
THE TOP AREAS FOR EV CHARGING COST
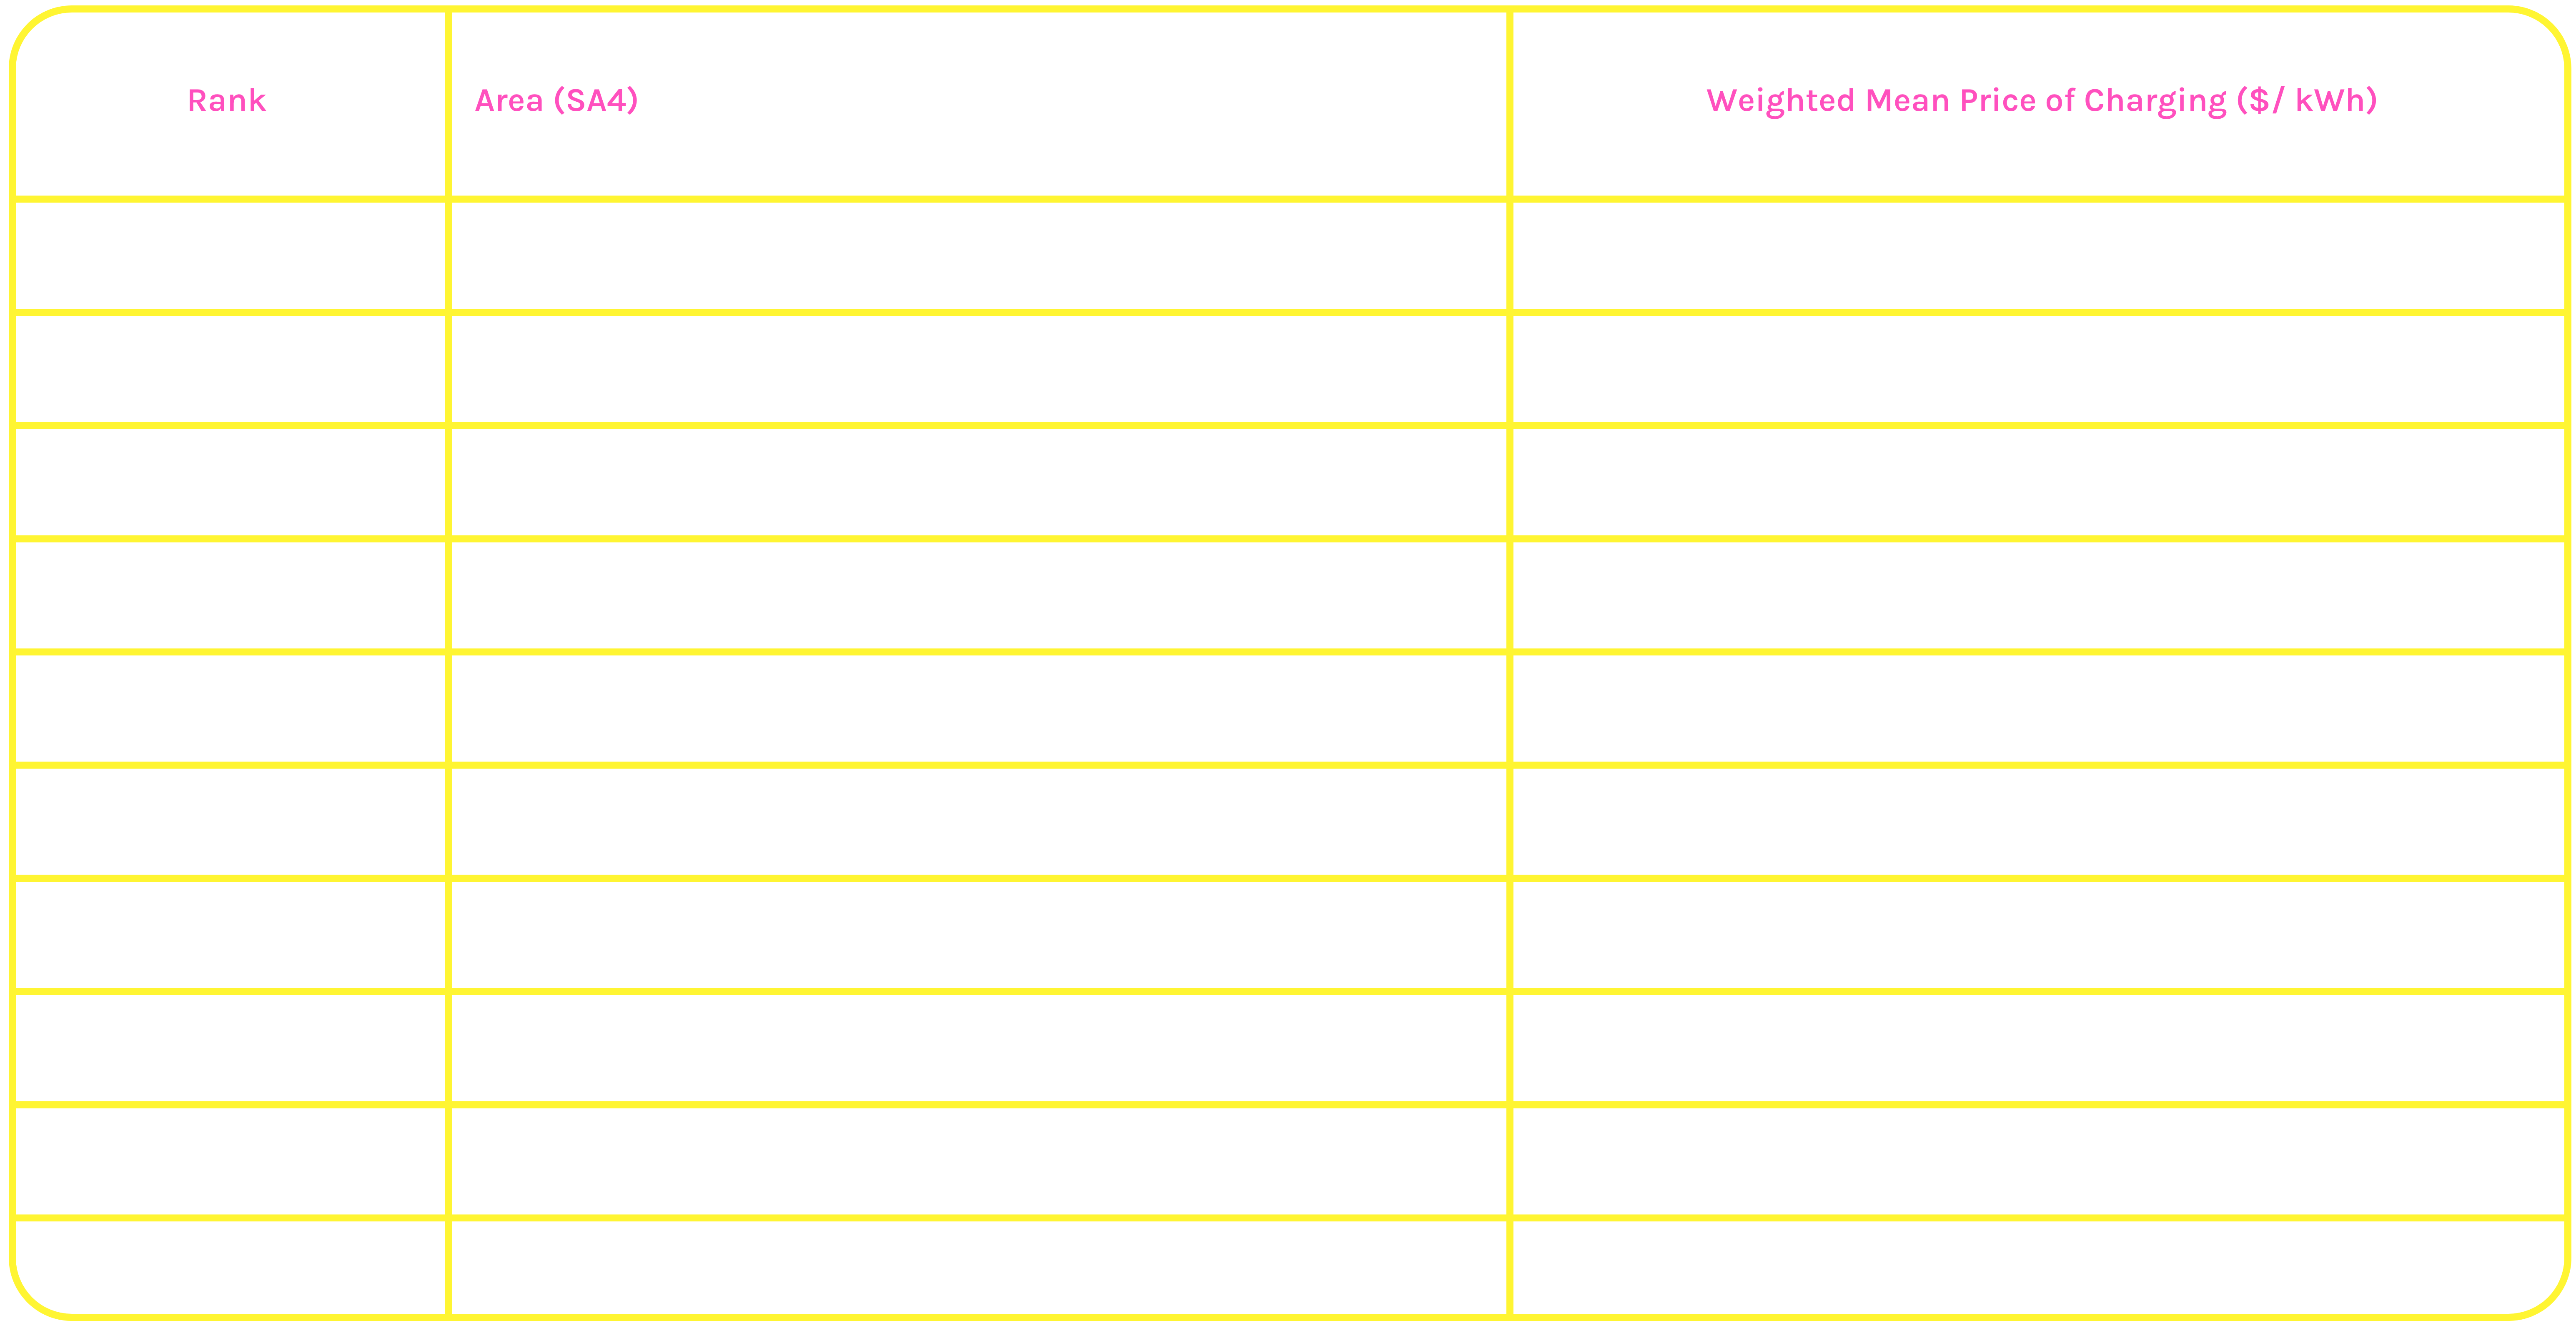
"Areas" refer to Australian Bureau of Statistics (ABS) Statistical Area Level 4 (SA4) regions. Charging cost reflects the connector-weighted mean price per kWh across publicly available charging networks with published pricing data within each area, and may not reflect all publicly accessible charging options or price variations across different charging speeds and networks. All figures are as at the date of data collection (April 2026) and reflect publicly accessible charging stations only.
Depending on driving distance, most EV drivers charge their vehicle roughly three to four times a week, meaning small charging costs can quickly add up. The good news? South Australia and New South Wales lead for affordability, claiming seven of the top 10 cheapest charging areas. The lowest average costs are seen in Sydney’s Ryde and South West, as well as Central and Hills in Adelaide, all of which are below 40 cents per kWh. For locals, that means regular charging can stay budget-friendly and fit easily into everyday life.
THE TOP AREAS FOR EV UPTAKE
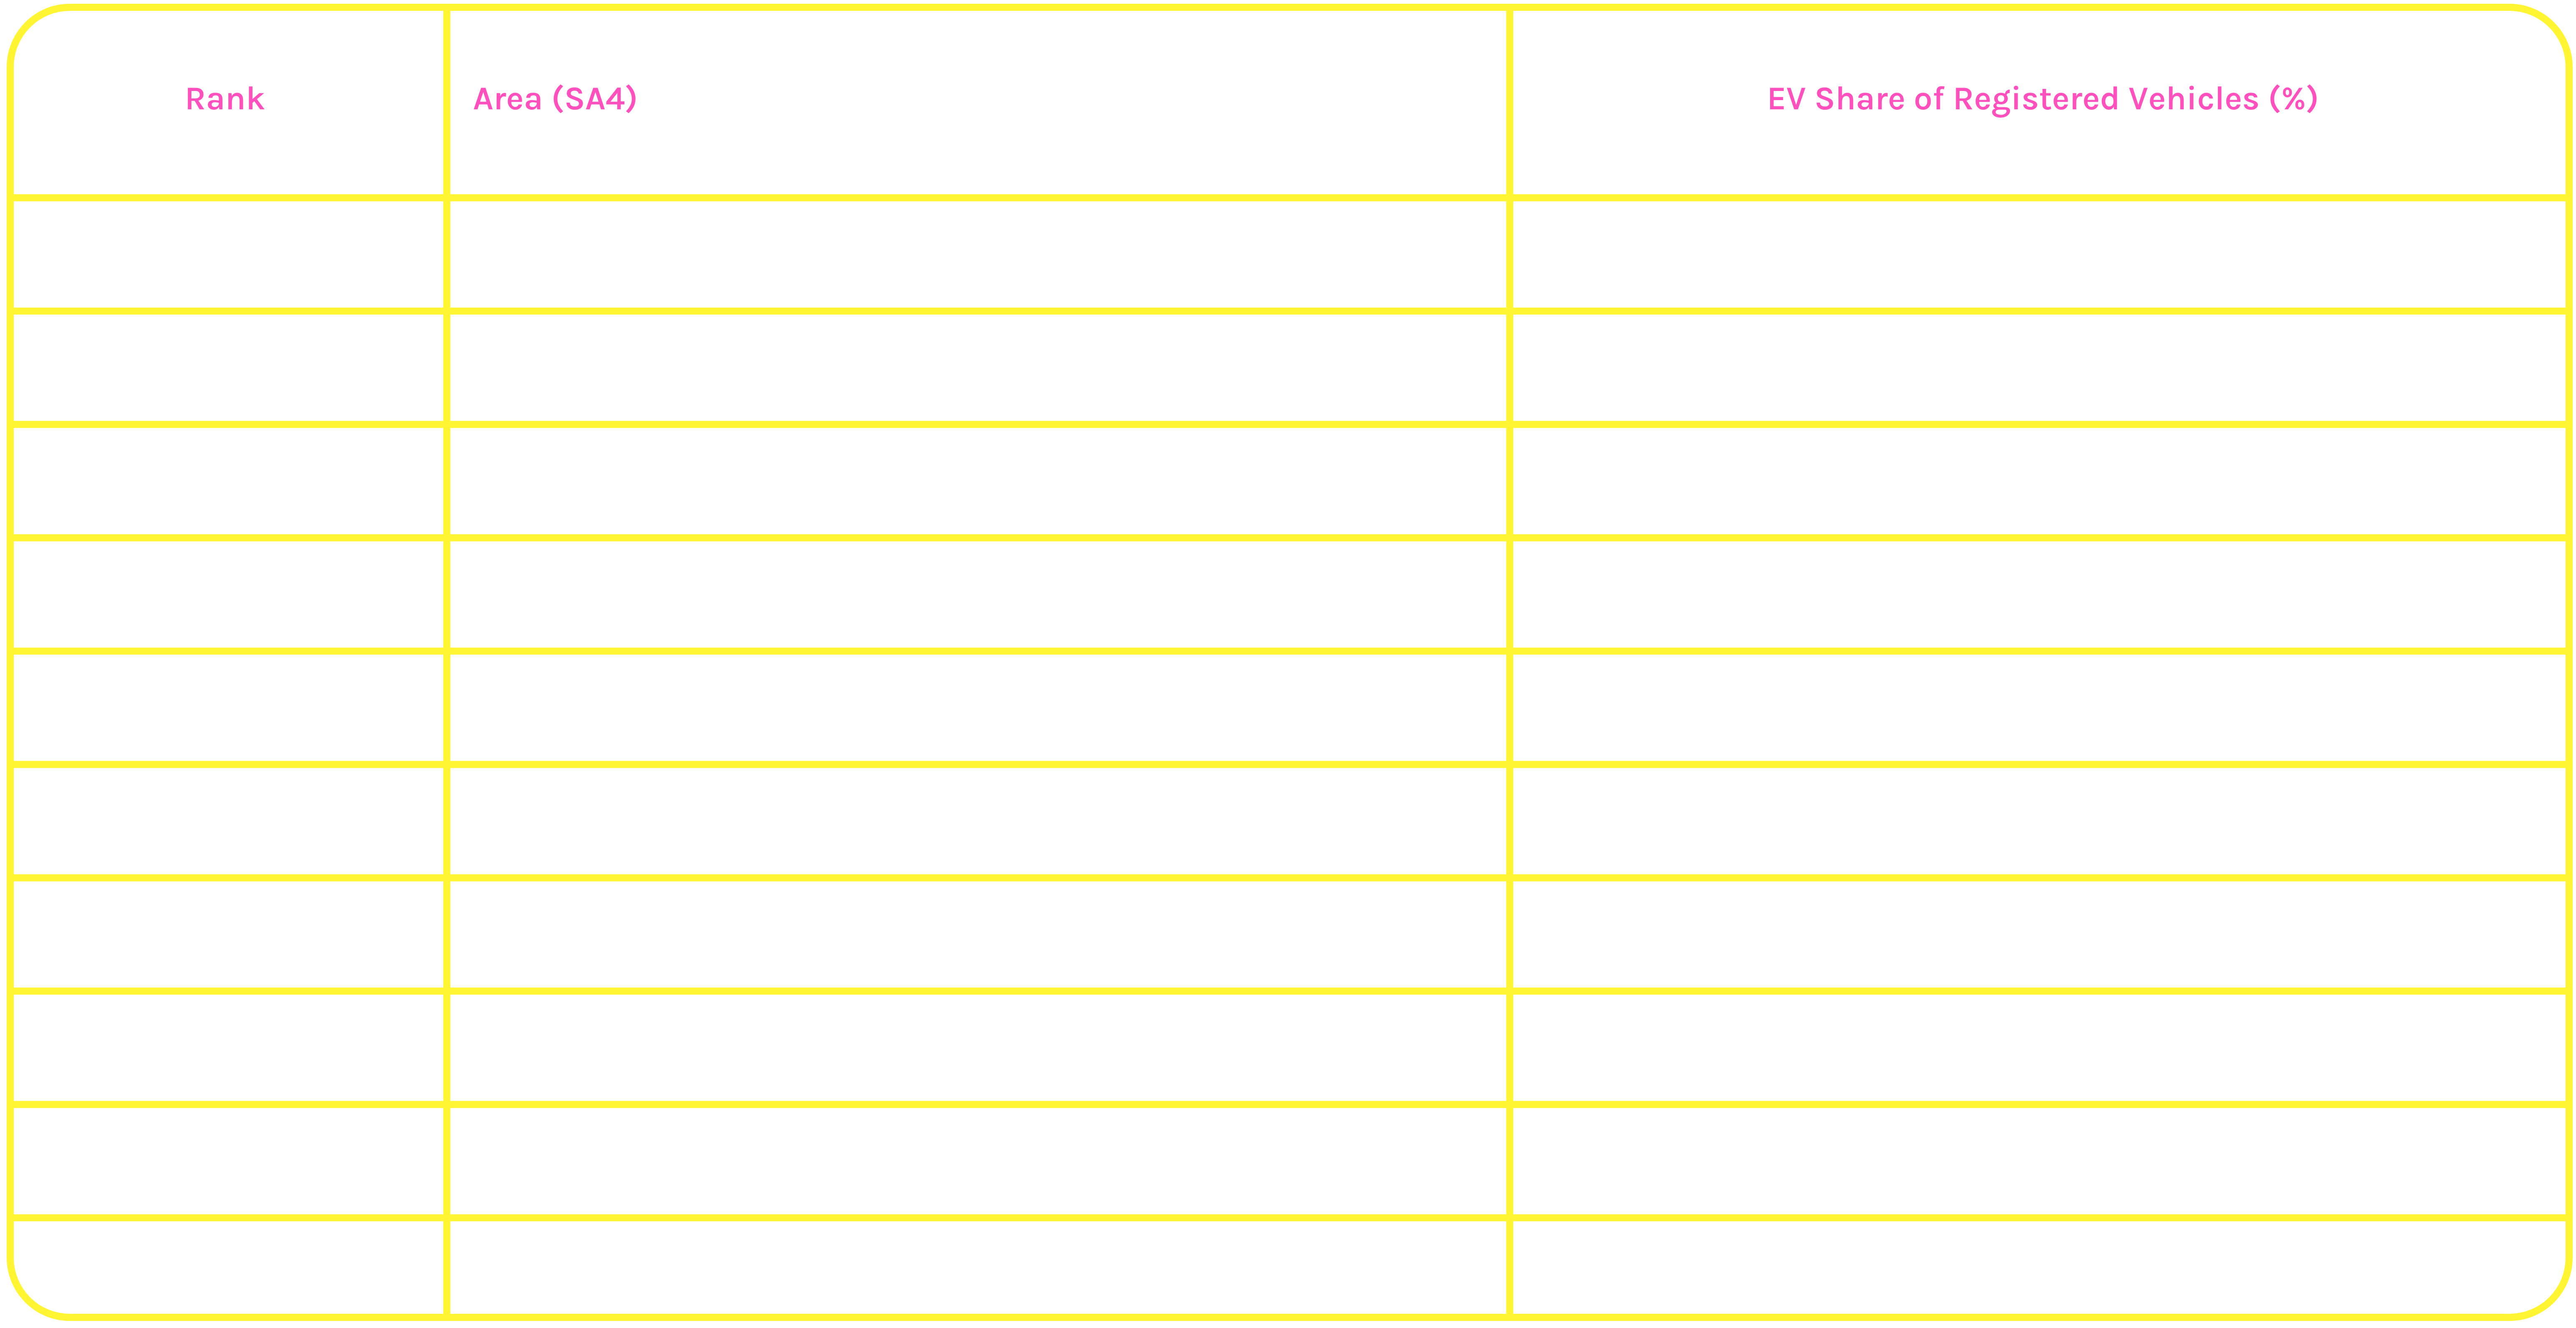
"Areas" refer to Australian Bureau of Statistics (ABS) Statistical Area Level 4 (SA4) regions. EV Uptake is measured as BEV share of the total light vehicle fleet in each SA4 as at January 2025 (BITRE - Road Vehicles, Australia).
The ‘EV share of registered vehicles’ represents the amount of registered light and passenger vehicles that are EVs. The higher the percentage, the stronger the local uptake.
It’s no surprise, then, that EV uptake tends to be highest in inner-city and higher-income areas where infrastructure, charging access and lifestyle all line up. Sydney boasts four areas in the top 10, with the City and Inner South recording the highest EV share in Australia. At 4.01%, this is more than three times the average across all 88 areas studied (1.09%).
North Sydney and Hornsby, Brisbane’s Inner City, the ACT, and Ryde round out the top five, reinforcing the link between EV adoption, urban living and socioeconomic factors.
THE TOP AREAS FOR EV GROWTH
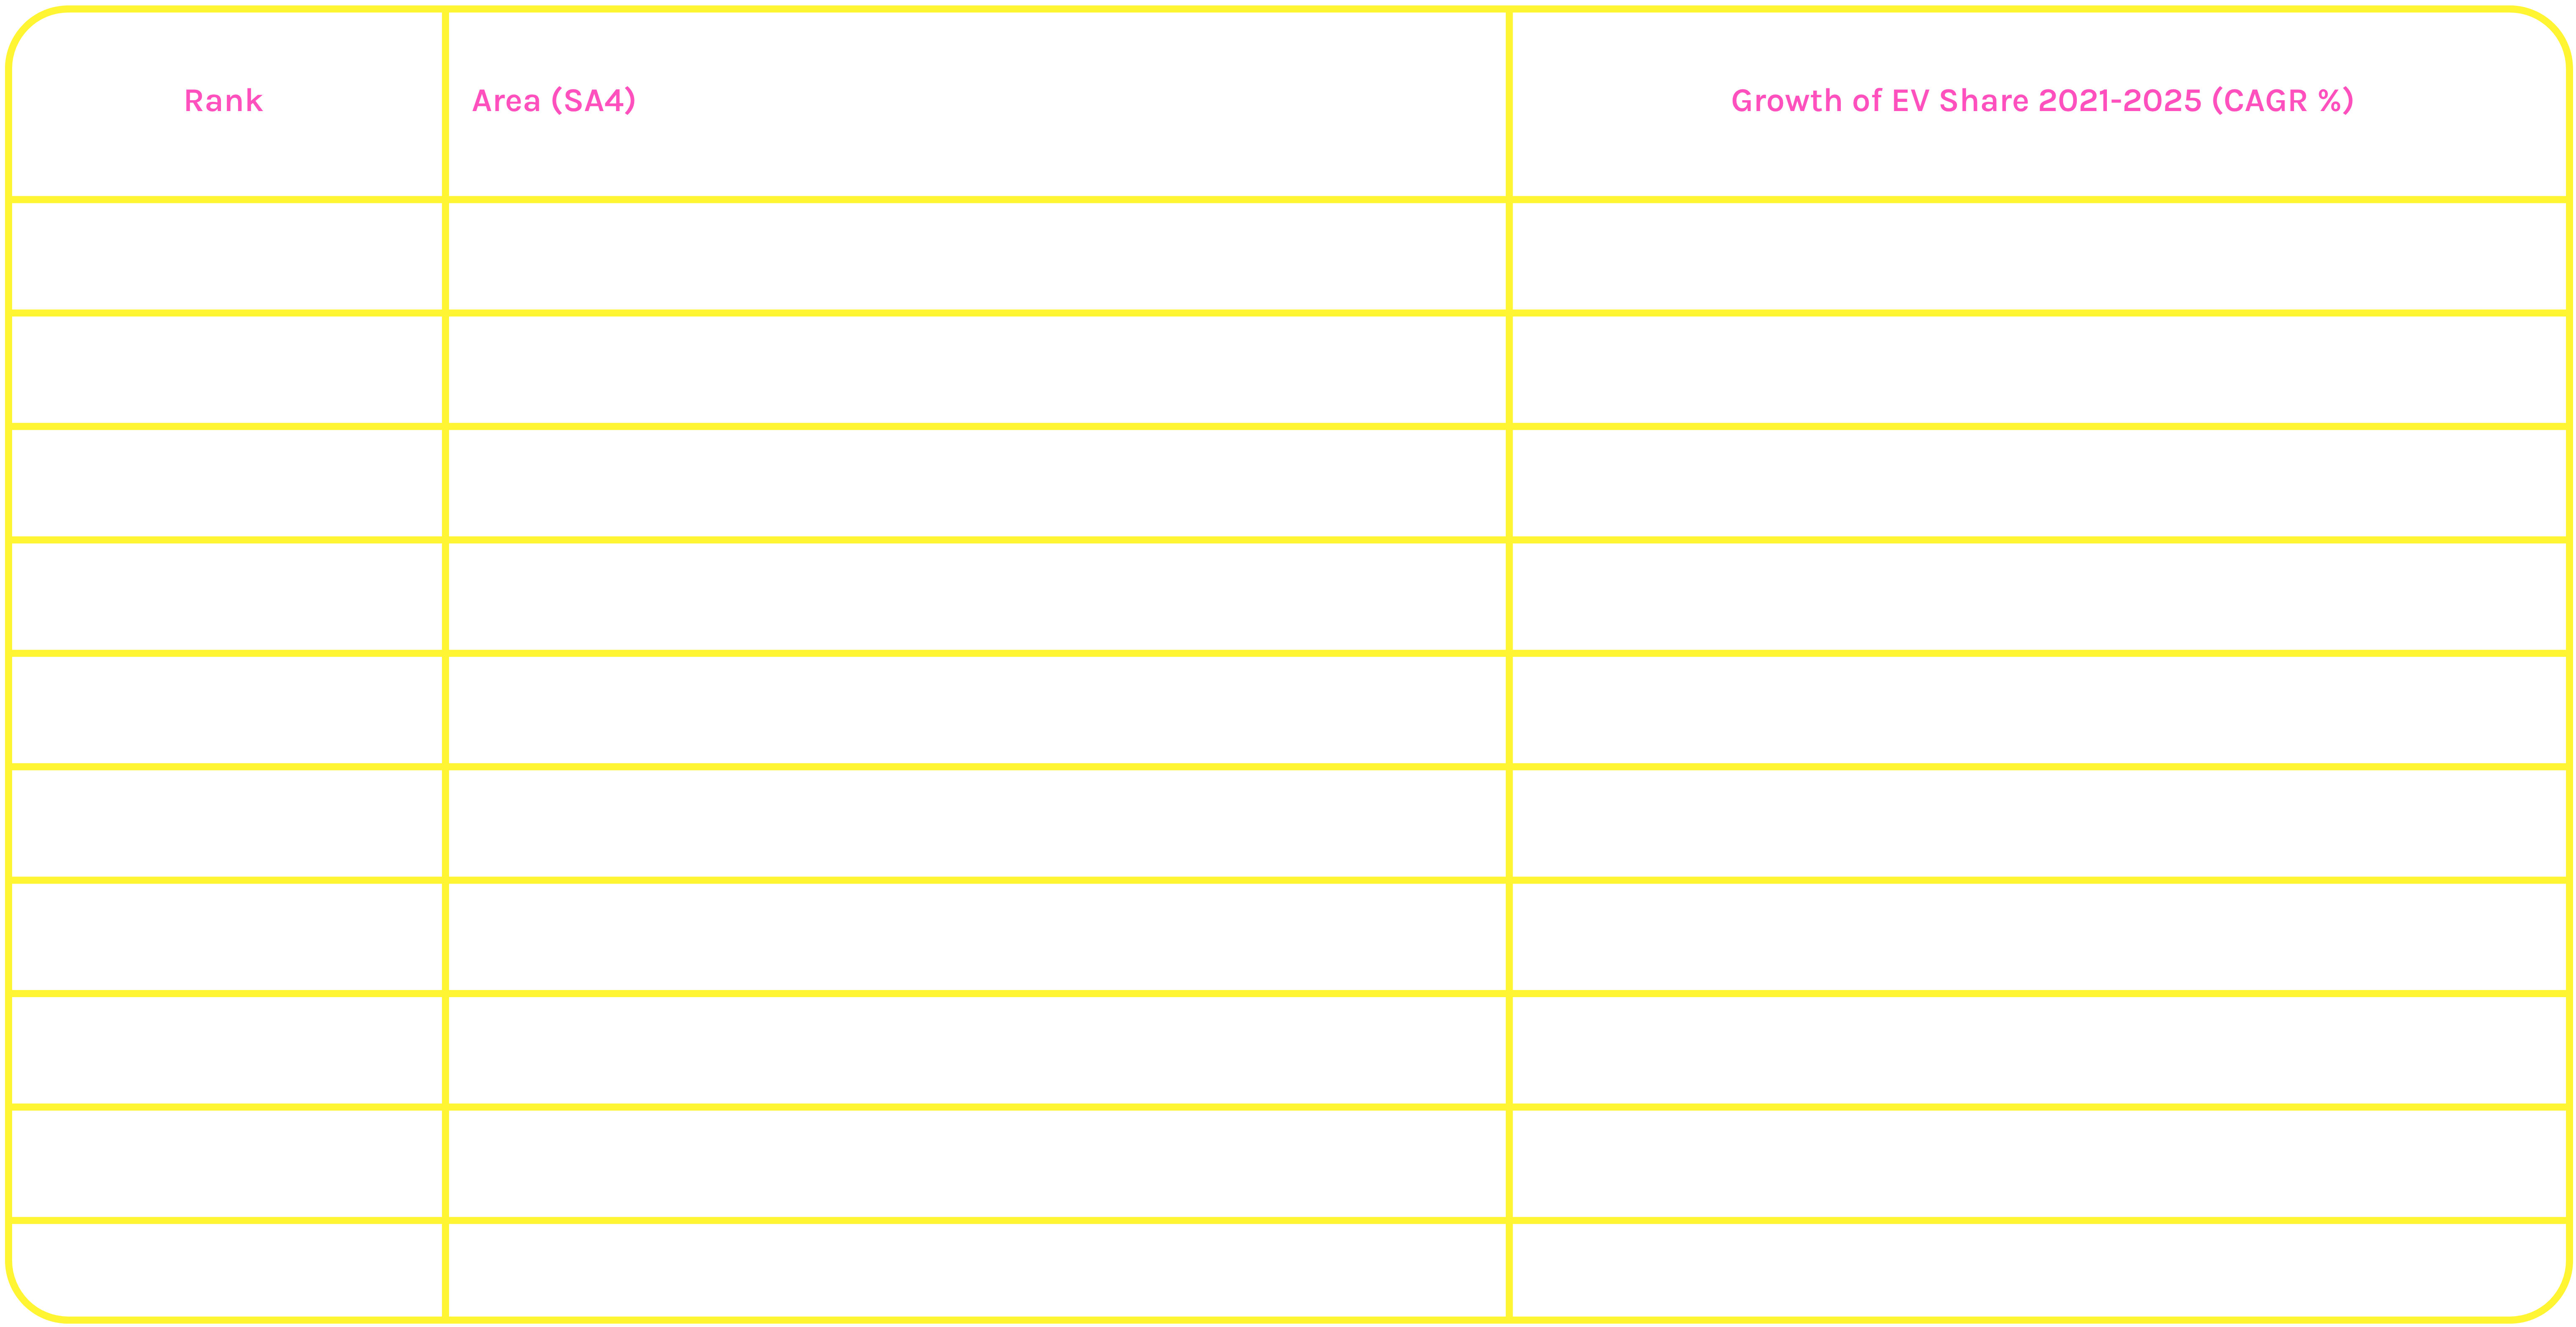
"Areas" refer to Australian Bureau of Statistics (ABS) Statistical Area Level 4 (SA4) regions. EV Growth is measured as the Compound Annual Growth Rate (CAGR) of BEV registrations between January 2021 and January 2025 (BITRE - Road Vehicles, Australia).
Surprisingly, it’s the regional and outer-suburban areas that are leading the way for EV growth. In Queensland’s Mackay - Isaac - Whitsunday, EV ownership is developing quickly, recording 149.5% average annual growth. The South Australian Outback and Darling Downs follow closely, both growing by 141% on average each year. This shows that more locals in these areas are choosing to make the switch.
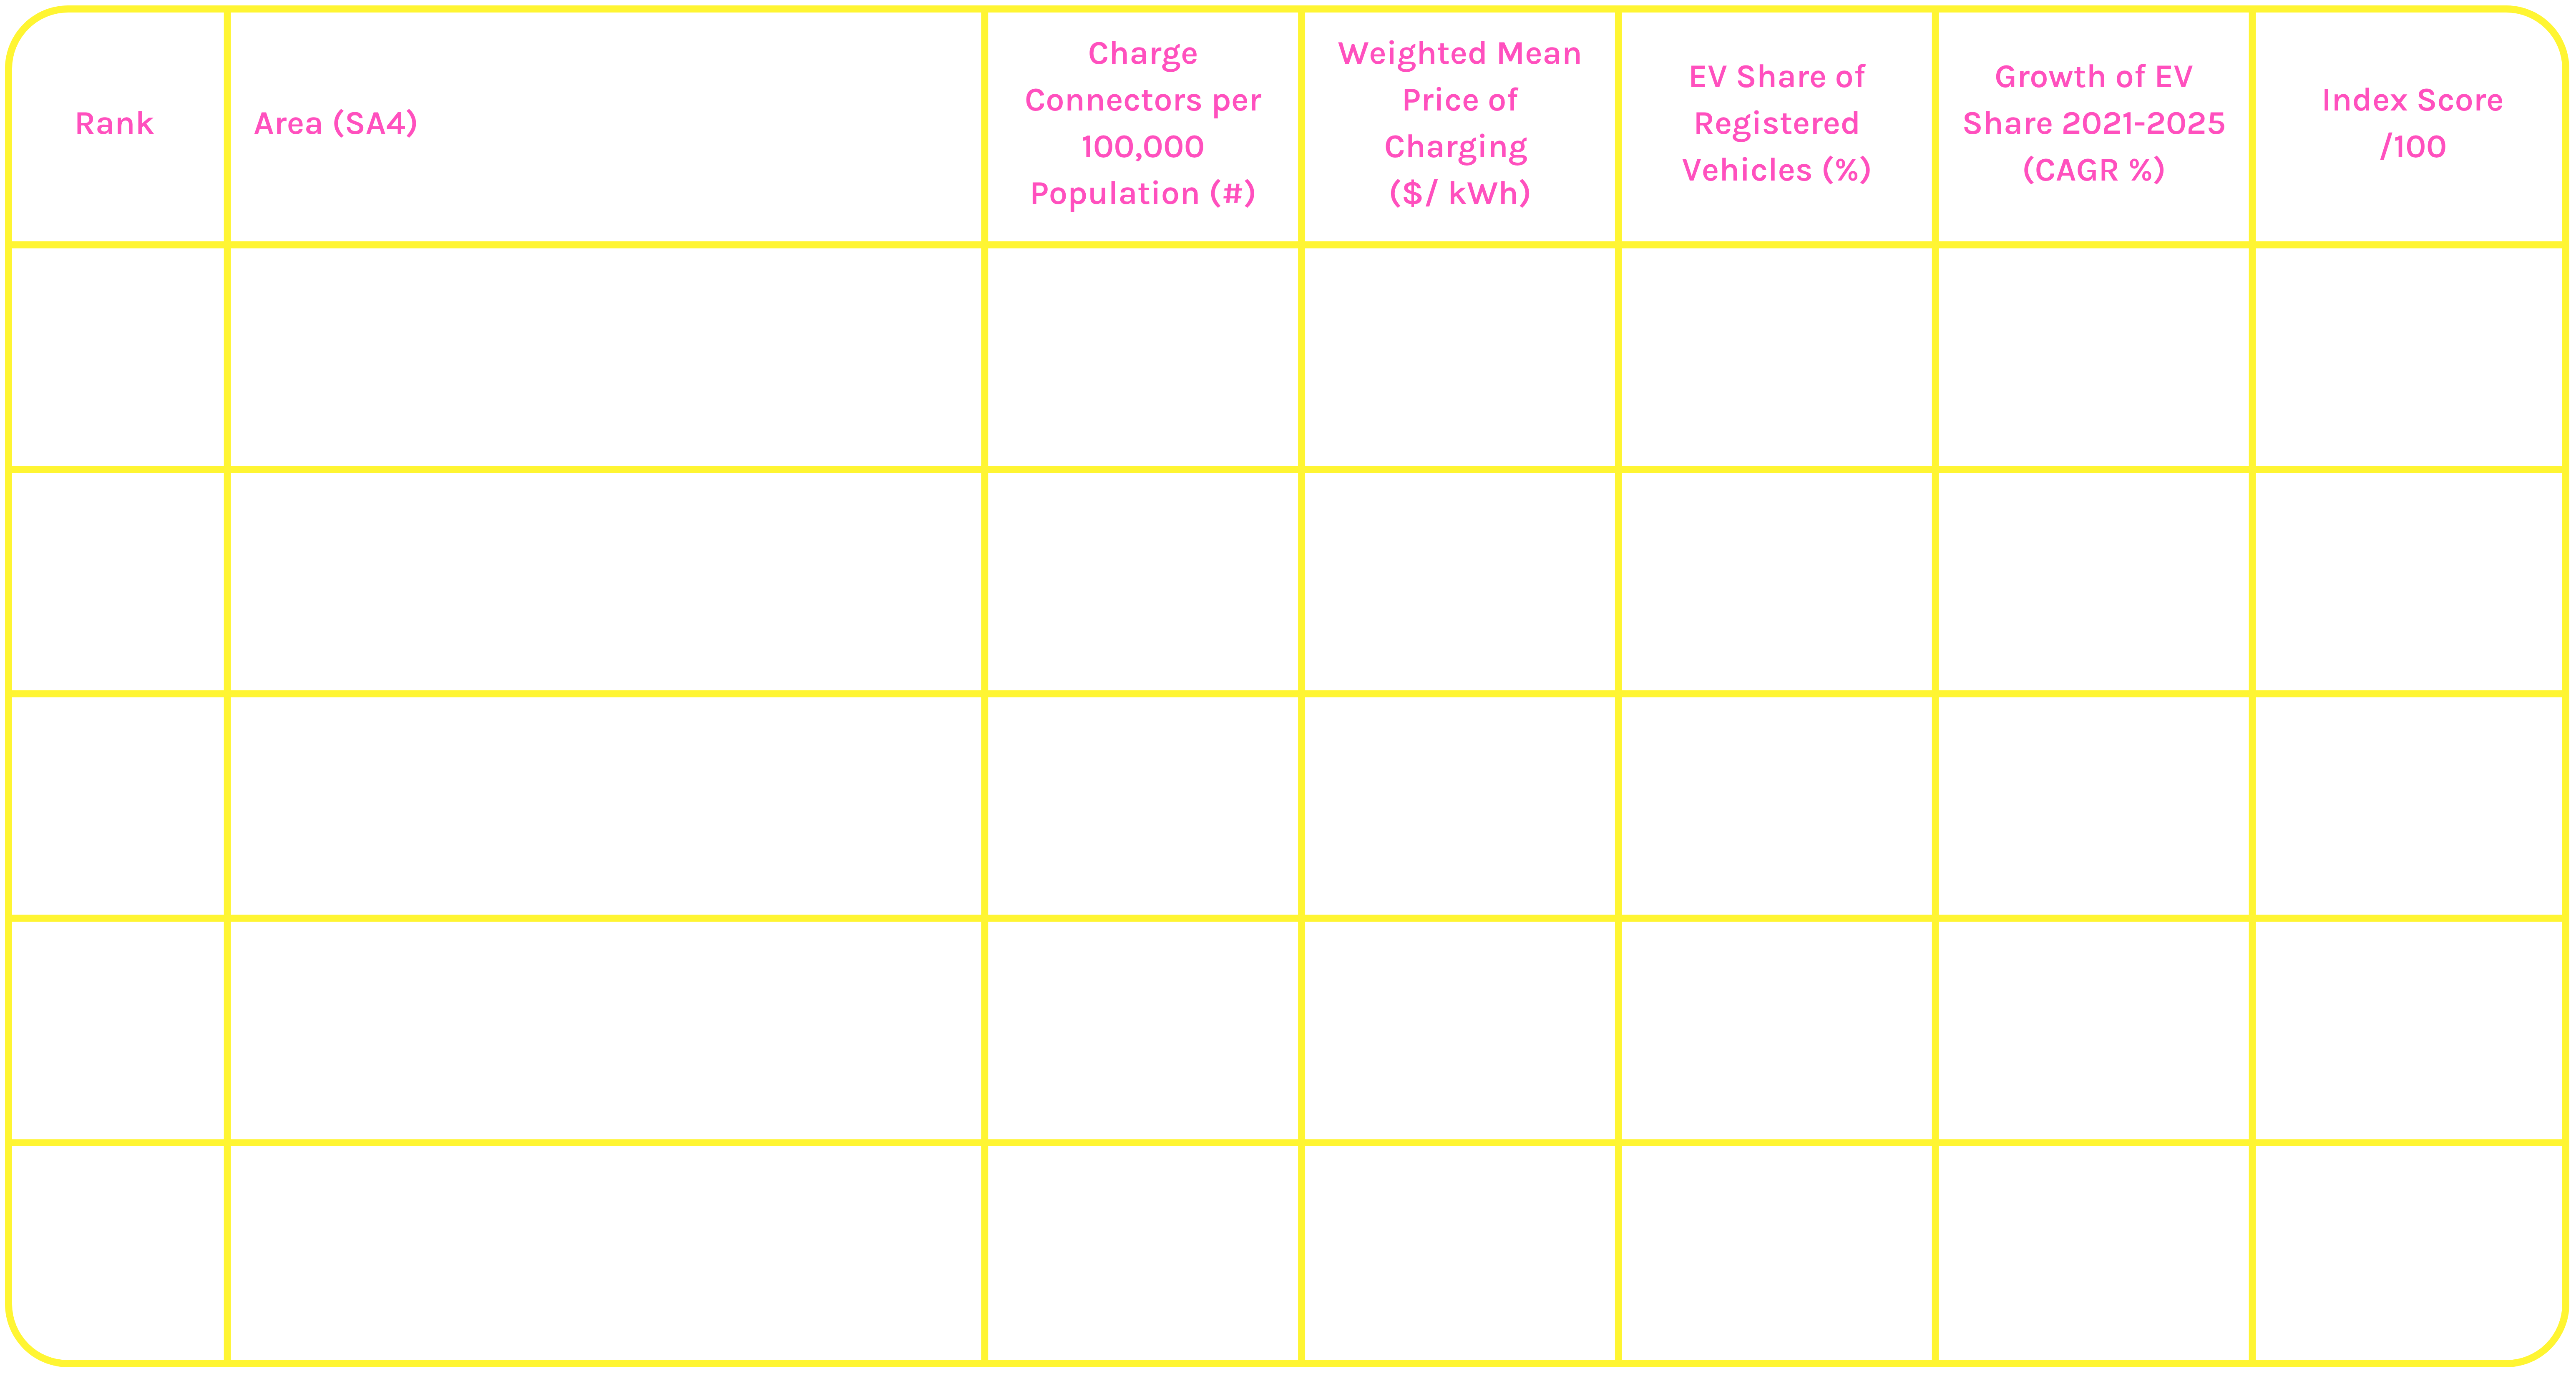
AREAS WITH MORE LIMITED EV INFRASTRUCTURE
"Areas" refer to Australian Bureau of Statistics (ABS) Statistical Area Level 4 (SA4) regions. Charging cost reflects the connector-weighted mean price per kWh across publicly available charging networks with published pricing data within each area, and may not reflect all publicly accessible charging options or price variations across different charging speeds and networks. All figures are as at the date of data collection (April 2026) and reflect publicly accessible charging stations only.
EV‑friendly conditions aren’t evenly distributed across Australia, with some regions still in earlier stages of infrastructure development. The Northern Territory’s Outback and Darwin record lower overall scores (37.04 and 39.16), alongside some of the highest average charging costs nationally, which can make ongoing running costs less accessible for drivers.
Across the listed areas, EV ownership remains relatively low, with electric vehicles accounting for less than 1% of registered vehicles in each of the bottom 10 areas. This suggests that more limited infrastructure and higher charging costs can play a role in slower adoption, particularly as networks continue to expand.
THE MOST EV-FRIENDLY RURAL AREAS IN AUSTRALIA
"Areas" refer to Australian Bureau of Statistics (ABS) Statistical Area Level 4 (SA4) regions. Charging cost reflects the connector-weighted mean price per kWh across publicly available charging networks with published pricing data within each area, and may not reflect all publicly accessible charging options or price variations across different charging speeds and networks. All figures are as at the date of data collection (April 2026) and reflect publicly accessible charging stations only.
Looking at the data on a rural level, multiple areas in South Australia dominate the rankings. Barossa - Yorke - Mid North takes the top spot as the best rural area to own an EV. With more than 200 chargers per 100,000 people - the highest rate in the entire study - it offers a level of EV infrastructure you might not expect outside a major city. South Australia’s South East and Outback also boast over 170 chargers per 100,000, making regional EV driving feel easy, modern and well-supported.
Charging prices in these rural areas are also quite moderate, ranging from $0.52 to $0.43 per kWh. In fact, Barossa - Yorke - Mid North ranks 6th for affordability across the entire study, closely followed by the South East (SA) at 13th. Clearly, there are several rural areas that are making EV travel both affordable and well-supported through the right infrastructure.
Yet despite these supporting factors, the share of EVs on rural roads sits below 0.55% for all areas. But growth is happening. All top-scoring rural areas record over 100% average annual growth, suggesting that EV adoption may still be in its early stages but is growing quickly as infrastructure expands and awareness builds.
Brendan Griffiths, Executive Manager at ROLLiN’ comments:
“Electric vehicles have quickly shifted from a niche choice to a practical one, and where you live can play a big role in how appealing that transition is. EV‑friendly areas are those that support everyday driving with accessible charging, manageable costs and growing local adoption.”
“While inner‑city areas still lead when it comes to EV uptake, the data shows regional Australia is making strong progress. Some regional centres now offer higher charger density than major cities, highlighting how EV ownership is becoming more practical across a broader range of locations.”
“As EV ownership continues to rise, Australians are showing growing interest in which areas are best set up to support the switch.”
The information in this article is accurate at the date of publication. However, customers should not solely rely on the data presented when making decisions about purchasing an electric vehicle (EV). We encourage readers to conduct additional research and consider other factors that may influence their decision, including updated information and individual preferences.
About the data
EV Charging Infrastructure and Cost
Public EV charging infrastructure data was compiled from six national sources (Chargefox, Charge@Large, Open Charge Map, Evie Networks, Exploren and PlugShare), capturing almost 6,000 unique charging stations and over 15,000 connectors across Australia. Where the same physical station appeared across multiple sources, it was deduplicated using a 50-metre spatial proximity match, with data filtered to publicly accessible stations only.
Each station was assigned to its SA4 region, and total connectors were normalised against the 2025 Estimated Resident Population (ABS Regional Population) to produce a connectors-per-100,000-residents figure. Connectors were used rather than stations because a site with multiple plugs provides substantially more charging capacity than a single-plug destination charger.
Charging cost is based on station-level pricing data from the two networks in the dataset that publish structured $/kWh pricing, covering over 1,200 stations nationally. The connector-weighted mean price across all priced stations within each SA4 was used as the regional cost indicator, with higher-capacity stations weighted proportionally. Data was collected in April 2026 and represents a point-in-time snapshot. While every effort has been made to ensure accuracy through cross-source validation and deduplication, individual station records have not been independently verified.
EV Uptake and Growth
Battery Electric Vehicle (BEV) registration data was sourced from the Bureau of Infrastructure, Transport and Regional Economics (BITRE) Road Vehicles Australia dataset, covering January 2021 to January 2025, and filtered to passenger vehicles and light commercial vehicles only.
Postcode-to-SA4 allocation used a population-weighted concordance built from ABS boundary shapefiles and the ABS Regional Population GeoTIFF (2025). Where a postcode crossed an SA4 boundary, BEV registrations were split proportionally based on the share of population within each SA4, ensuring vehicle counts reflect where residents actually live.
EV Uptake is measured as BEV share of the total light vehicle fleet in each SA4 as at January 2025. EV Growth is measured as the Compound Annual Growth Rate (CAGR) of BEV registrations between January 2021 and January 2025, providing a smoothed, annualised growth figure that is comparable across regions regardless of base year size.
Index Methodology
For the purpose of this report, ABS Statistical Area Level 4 (SA4) regions are referred to as "Areas", and Greater Capital City Statistical Areas (GCCSAs) are referred to as "Cities”.
Each of Australia's 88 SA4 regions is scored across four metrics, normalised to a 0-100 scale and weighted to produce a final index score.
Infrastructure and Uptake were normalised using a log-transformed min-max method to account for right-skewed distributions. Cost was normalised using an inverted min-max method, as lower prices represent a better outcome for drivers. Growth was normalised using standard min-max normalisation.
Capital city rankings are based on Greater Capital City Statistical Areas (GCCSAs) as defined by the ABS, with SA4-level data aggregated to GCCSA level using population-weighted totals. The Australian Capital Territory, Greater Darwin and Greater Hobart each correspond to a single SA4 region, and their GCCSA figures (outside of index scores) are therefore identical to their SA4 figures.
To highlight standout regional performers, SA4s were grouped using the ABS Remoteness Areas framework, which ranks every part of Australia by road distance to major service centres (the ARIA+ index). The same scoring methodology was applied nationally, with the top Outer Regional and Remote / Very Remote SA4s then pulled out for separate ranking.
Petrol vs EV Cost Comparison
To illustrate the real-world cost difference between petrol and electric vehicles, a standardised cost-per-100km comparison was calculated for each Australian capital city. The reference electric vehicle is the 2024 Tesla Model 3 RWD (H6MRB) with an energy consumption of 13.8 kWh per 100km, while the reference petrol vehicle is the Toyota RAV4 Edge 2.5L 4-cylinder Petrol, 8-speed Auto, 4WD with a combined fuel consumption of 7.0L per 100km, as listed on the Australian Government Green Vehicle Guide.
EV charging costs use the connector-weighted mean price per kWh for each capital city GCCSA as derived from this study. Petrol prices are city-level daily average retail unleaded (ULP) prices as at 29 April 2026, sourced from the Australian Competition and Consumer Commission (ACCC) petrol monitoring report. All figures are rounded to the nearest cent.
Changes from the 2024 Index
The Government Incentives variable has been removed from the 2026 index. Since the 2024 campaign, five of eight states have closed their major EV rebate programs, leaving insufficient variation across SA4 regions to meaningfully differentiate scores. Incentive data is retained as contextual background in this report.
The charging infrastructure dataset has been expanded from one to six national sources. The infrastructure metric now measures connectors per 100,000 residents rather than a raw station count, and the cost metric now uses a connector-weighted mean derived from directly collected pricing data rather than an unweighted median from a single commercial source. BEV registration data has been updated to the 2025 release with the growth measure extended from a 2-year percentage point change to a 4-year CAGR.
Due to these cumulative methodology changes, direct rank comparison with the 2024 index is not recommended.
This is general advice only and does not take into account your individual objectives, financial situation or needs (“your personal circumstances”). Before using this advice to decide whether to purchase a product, you should consider your personal circumstances and the relevant Product Disclosure Statement. Product Disclosure Statement and Target Market Determination are available from rollininsurance.com.au. Insurance issued by Insurance Australia Limited ABN 11 000 016 722 AFSL 227681 trading as Rollin’ Insurance.
To find out more about ROLLiN’s comprehensive car insurance, check out our PDS.